When a browser loads a webpage, it sends HTTP requests to fetch various resources like images, CSS, and JavaScript files. The more requests your site makes, the slower it loads. In fact:
- 69–75 HTTP requests were needed for the median webpage in 2019.
- Increasing requests to 250 can delay load times by 0.89 seconds (14%).
- Slow load times (3+ seconds) cause 40% of users to leave the site.
Reducing HTTP requests is key to improving speed. Combining files, optimizing images, and using caching can help. Upgrading to HTTP/2 or HTTP/3 further enhances performance by allowing multiple requests over a single connection. Tools like Chrome DevTools or Google Lighthouse can help identify and address bottlenecks. Faster load times mean better user experience and improved search rankings.
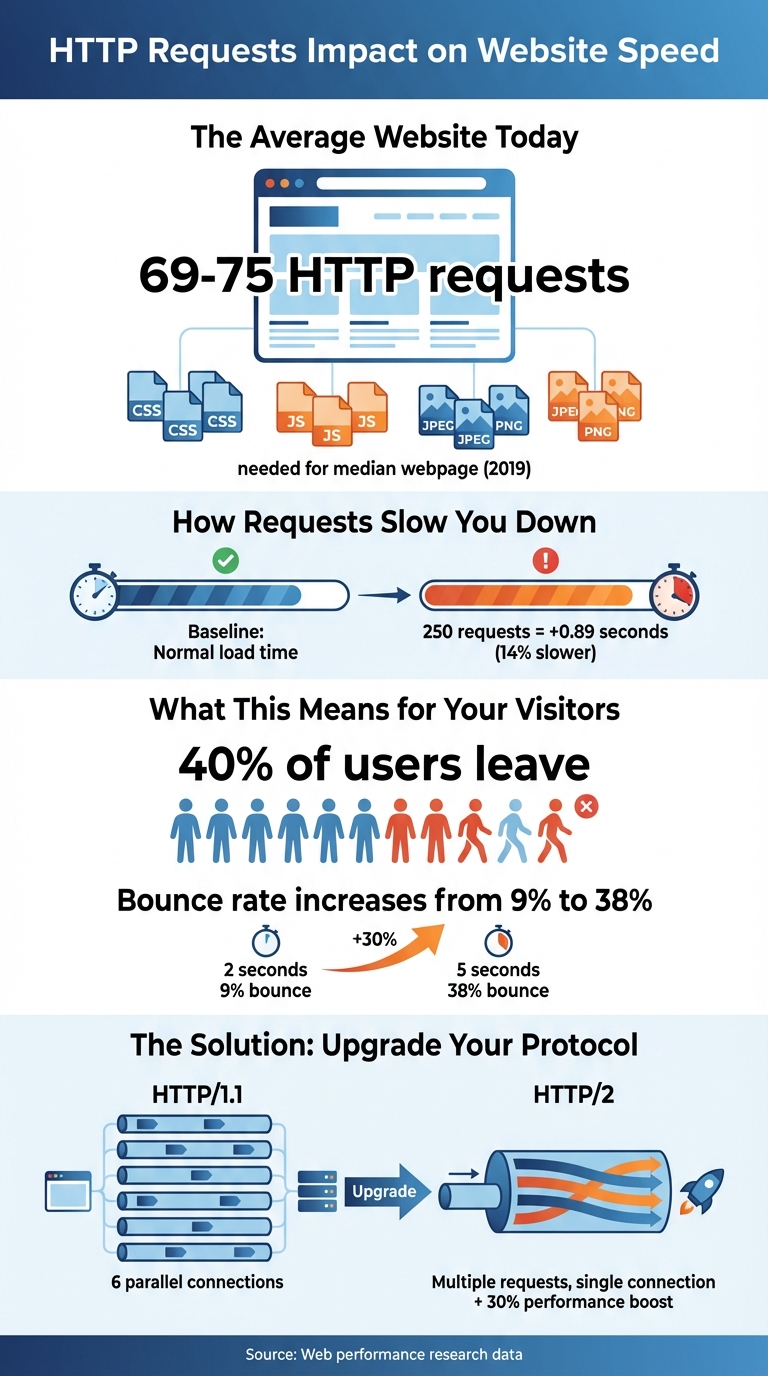
HTTP Requests Impact on Website Load Speed and User Behavior
Reducing HTTP Requests: Effective Techniques to Speed Up Your Website
What Are HTTP Requests?
HTTP, or HyperText Transfer Protocol, is the "language" that browsers and servers use to exchange data. It’s how your browser communicates with a server to request and retrieve files.
When you visit a website, your browser sends an HTTP GET request for each required file, and the server responds with those resources. But here’s the thing: a webpage isn’t just a single file. It’s made up of multiple resources, and your browser must send a separate HTTP request for each one.
Before any requests are sent, the browser goes through a few steps: performing a DNS lookup, setting up a TCP connection, and, if the site uses HTTPS, completing a TLS negotiation. Once the browser gets the initial HTML document, it starts parsing the code. Each external resource it encounters – like a <link> tag for CSS or an <img> tag for an image – triggers additional HTTP requests to fetch those assets.
Neil Patel, Co-Founder of NP Digital, sums it up well:
"HTTP stands for ‘HyperText Transfer Protocol.’ Think of HTTP as the language browsers and web servers use to talk to each other."
Common Resource Types
Webpages are built from a mix of files, and each requires its own HTTP request. The HTML document is always the first request – it’s the blueprint that tells the browser what else to load.
- CSS files: These control the look of the site, including layout, colors, and fonts.
- JavaScript files: These add dynamic features, like dropdown menus or social media buttons.
- Images and multimedia: Formats like JPG, PNG, SVG, GIF, and videos each need their own request.
- Web fonts: Fonts such as WOFF and WOFF2 are also fetched separately.
Additionally, third-party resources – like analytics scripts, ads, chat widgets, or embedded YouTube videos – often make up a big chunk of these requests. Knowing what files your site loads can help you identify areas for improvement.
HTTP/1.1 vs. HTTP/2
The version of HTTP your server uses has a big impact on how requests are handled.
- HTTP/1.1: This older standard processes requests one at a time per connection. Browsers like Chrome usually limit parallel TCP connections to six per server, which can create bottlenecks. This leads to "head-of-line blocking", where one slow request delays others. Additionally, HTTP/1.1 sends headers as uncompressed plain text, adding unnecessary data overhead.
- HTTP/2: This newer version introduces multiplexing, allowing multiple requests and responses to share a single TCP connection simultaneously. It compresses headers to reduce size and includes features like server push, where the server sends resources before the browser even asks for them. HTTP/2 also allows stream prioritization, so the browser can decide which files should load first.
Ryan Hodson from Cloudflare highlights how HTTP/2 changes the game:
"HTTP/2 changes the way web developers optimize their websites. In HTTP/1.1, it’s become common practice to eek out an extra 5% of page load speed by hacking away at your TCP connections… Life’s a little bit easier in HTTP/2."
Switching to HTTP/2 can improve performance by up to 30% without requiring complex workflows. Unlike HTTP/1.1, where developers often combine files to reduce requests, HTTP/2 thrives on smaller, granular resources that can be cached independently and transferred in parallel. Understanding these protocol differences is key to tackling how too many requests can slow down a site.
How Too Many HTTP Requests Slow Down Your Website
When a browser loads a webpage, it needs to fetch multiple resources like images, scripts, and stylesheets. Each of these requires an HTTP request, and when there are too many, it can bog down the loading process. For example, browsers using HTTP/1.1 (like Chrome) can only handle about six parallel connections per host. Any extra requests are queued until a connection is free, creating delays that slow down your site’s performance.
This can have a direct impact on your visitors. Research shows that 40% of users abandon a site if it takes more than 3 seconds to load. Even a small increase in load time – from 2 to 5 seconds – can cause bounce rates to jump from 9% to 38%.
Another issue is that CSS and JavaScript files are render-blocking by default. This means the browser won’t display any content until these files are fully downloaded and processed. By combining these files into fewer requests, you can reduce this blocking effect and speed up rendering. Even with HTTP/2, which allows up to 100 parallel streams, excessive requests still hurt performance. Each request comes with overhead – like HTTP headers and backend processing – that adds up quickly. Plus, 40% to 60% of visitors arrive with an empty cache. For these first-time visitors, every single HTTP request adds to the delay.
Request Waterfalls Explained
A waterfall chart is a visual tool that shows the sequence and timing of each HTTP request on your site. You can view it in your browser’s DevTools, and it breaks down everything from the initial HTML document to images, scripts, and third-party widgets.
The chart uses colors to represent different phases, such as DNS lookup, connection setup, waiting for a server response, and downloading files. Long gray bars in the chart indicate "queuing time" – the period when the browser waits for a connection before fetching the resource.
Torque Magazine explains it like this:
"The Waterfall Chart displays the request-by-request loading behavior of a blog. It includes scripts, media files and third-party resources requested by your webpage."
These charts are invaluable for spotting bottlenecks. For instance, if you see many requests queuing up, it’s a sign that limited connections are causing delays. Third-party resources, like analytics trackers or social media embeds, often add extra DNS lookups, further increasing latency.
In HTTP/1.1, the six-connection limit makes these bottlenecks worse. Even with HTTP/2, overloading the available parallel streams can delay your page’s "onload" event, leaving users staring at a blank or partially loaded screen. These delays can push critical performance metrics far beyond acceptable thresholds.
Effects on Core Web Vitals
Too many HTTP requests can wreak havoc on key performance metrics like Largest Contentful Paint (LCP) and First Input Delay (FID). LCP measures how long it takes for the main content of a page to load. If your site is bogged down by non-essential CSS or JavaScript files, it can block rendering and cause LCP to skyrocket.
FID, on the other hand, tracks how quickly your site responds to user actions like clicks or taps. When the browser’s main thread is overloaded with JavaScript files, it delays these interactions, leading to a frustrating user experience.
Here’s a breakdown of how excessive requests affect Core Web Vitals:
| Core Web Vital | How Excessive Requests Hurt Performance |
|---|---|
| Largest Contentful Paint | Delayed by too many requests for images, large CSS files, or slow-loading hero content. |
| First Input Delay | Slowed down by heavy JavaScript that clogs the main thread, delaying user interactions. |
| First Contentful Paint | Blocked by render-blocking CSS and JavaScript files. |
| Time to Interactive | Increased when the browser is busy processing a high volume of scripts. |
Web Performance Engineer Ilya Grigorik highlights the importance of reducing these delays:
"Optimizing the critical rendering path allows the browser to paint the page as quickly as possible: faster pages translate into higher engagement, more pages viewed, and improved conversion."
Each HTTP request adds to the Critical Path Length – the total number of network round trips needed to load all essential resources. More requests mean more round trips, leaving users staring at a blank screen longer. Even small files can cause noticeable delays if they require multiple trips, especially when you factor in network latency (often around 100ms per trip) and server response times.
sbb-itb-3e387e1
How to Reduce HTTP Requests
Reducing HTTP requests is one of the most effective ways to speed up your website. The idea is simple: the fewer files your browser needs to fetch, the faster your page will load. Let’s dive into some practical methods to achieve this without compromising your site’s functionality or design.
Combine and Minify Files
Combining and minifying your files can significantly cut down on HTTP requests. Minification removes unnecessary characters like whitespace, comments, and extra semicolons. For JavaScript, this process often includes "uglification", where variable and function names are shortened to reduce file size even further. File concatenation takes it a step further by merging multiple CSS or JavaScript files into one, directly reducing the number of requests your browser has to make.
This method is especially useful for HTTP/1.1 connections, where combining files helps minimize delays caused by head-of-line blocking. Tools like Webpack, Vite, or Gulp can automate this process during your production build.
Avoid using @import in CSS files, as it creates a chain of requests that slows down loading. Instead, use <link> tags in your HTML to allow browsers to download stylesheets concurrently. For critical CSS – styles needed to render the visible portion of the page – consider inlining it directly into your HTML <head>. This eliminates the need for a separate request and improves metrics like First Contentful Paint (FCP).
| Technique | Primary Benefit | Best For |
|---|---|---|
| Minification | Reduces file size (bytes) | CSS, JS, and HTML files |
| Concatenation | Cuts down request count | HTTP/1.1 environments |
| Inlining | Eliminates request overhead | Critical "above-the-fold" CSS |
| Uglification | Shrinks JavaScript size | Production JavaScript bundles |
| Code Splitting | Loads only necessary files | Large Single Page Applications (SPAs) |
While combining files is effective, it’s worth noting that large bundles can lead to cache invalidation issues. A small change might force users to re-download an entire file. For sites using HTTP/2, multiplexing can handle multiple requests simultaneously, offering up to a 30% performance boost without requiring extensive bundling.
Optimize Images
Every image on your site generates a separate HTTP request, so reducing the number of images is an easy way to lower request volumes. For images you do need, lazy loading is a great solution. This approach delays loading images that aren’t immediately visible until the user scrolls to them. You can implement lazy loading with the loading="lazy" attribute on <img> elements or use lightweight plugins like LazyLoad (under 10 KB).
Another smart tactic is using CSS sprites, which combine multiple small images (like icons or buttons) into a single file. This allows the browser to retrieve several assets with just one request. For vector graphics, inlining SVGs directly into your HTML can eliminate external file requests altogether.
While compressing and resizing images won’t reduce the number of requests, it can prevent large files from slowing down the page. Aim to keep individual image sizes under 100 KB. Tools like Squoosh or TinyPNG make it easy to balance image quality with smaller file sizes. Switching to next-gen formats like WebP can also help, as these formats offer better compression than JPEG or PNG.
Slow-loading images can frustrate users, with up to 39% of visitors abandoning sites with poor image performance. As Neil Patel puts it:
"Every image creates an HTTP request. While those fun GIFs might have visual appeal, they won’t impress your audience if they affect load time".
Remove Unused Code
Bloated code can unnecessarily increase HTTP requests. Audit your site for unused plugins, scripts, and stylesheets using tools like Chrome’s Coverage tool. Removing or replacing these can make a big difference.
For CSS, tools like PurgeCSS can automatically strip out styles that aren’t being used, reducing both file size and HTTP requests. If you rely on third-party scripts like Google Analytics, consider hosting them locally. This gives you more control over caching and reduces the need for external requests.
If a script is essential and can’t be removed, use the async or defer attributes. These attributes prevent scripts from blocking the rendering of your page, improving perceived load times even if the number of requests stays the same. As YSlow explains:
"Decreasing the number of components on a page reduces the number of HTTP requests required to render the page, resulting in faster page loads".
Advanced Methods to Improve Website Speed
Improving website speed often requires more than just basic optimizations. Advanced techniques, like upgrading protocols and refining caching strategies, can shave off precious seconds from load times while keeping your site’s design intact.
Upgrade to HTTP/2 or HTTP/3
Switching from HTTP/1.1 to HTTP/2 can improve performance by as much as 30% without requiring a complex overhaul. This boost comes from multiplexing, which allows multiple files to download simultaneously over a single connection. In contrast, HTTP/1.1 processes files one at a time, creating bottlenecks. HTTP/2 also uses HPACK header compression, cutting down on repetitive metadata like cookies, which can add hundreds of bytes to each transfer under HTTP/1.1. Plus, it reduces the need for extra TLS handshakes by maintaining a single persistent connection per origin.
HTTP/3 takes things further with the QUIC protocol, eliminating head-of-line blocking at the transport layer and further reducing latency.
As Ilya Grigorik from web.dev explains:
"The ability to break down an HTTP message into independent frames, interleave them, and then reassemble them on the other end is the single most important enhancement of HTTP/2".
If you’re still using domain sharding – a trick from the HTTP/1.1 era where resources are spread across multiple domains to bypass connection limits – stop now. This outdated method adds unnecessary DNS lookups and TLS handshakes, while also interfering with HTTP/2’s stream prioritization. Instead, focus on serving smaller, modular files rather than large, combined ones to improve caching efficiency.
Once your protocols are updated, turn your attention to browser caching for even faster load times.
Set Up Browser Caching
Browser caching is a powerful way to reduce repeated HTTP requests for returning visitors. By properly configuring caching headers, you can ensure that frequently accessed files are served locally, cutting down on load times. The key headers to use are Cache-Control and ETag.
For static assets like images or scripts, use:
Cache-Control: public, max-age=31536000, immutable
This caches the file for a full year without requiring server revalidation. The immutable directive prevents the browser from unnecessarily rechecking the file, even during a reload.
For dynamic content that changes often, like HTML files, use:
Cache-Control: no-cache
This ensures the browser verifies with the server before loading a cached version, so users always see the latest updates. Avoid using no-store unless you’re dealing with highly sensitive data, as it blocks caching entirely.
ETags provide another layer of efficiency. When a cached file expires, the browser sends an If-None-Match request to check if the file has been updated. If not, the server responds with a lightweight 304 Not Modified message instead of sending the entire file again.
As Request Metrics puts it:
"The fastest website is the website that is already loaded, and that’s exactly what HTTP caching delivers".
To ensure users always receive the latest updates while still benefiting from caching, use cache busting. Add a version number or content hash to your file names (e.g., style.v2.css or app.abc123.js). This lets you set aggressive caching policies while guaranteeing that updated files are loaded immediately.
Review Third-Party Scripts
Even after optimizing protocols and browser caching, third-party scripts can slow your site down. These scripts – such as Google Analytics, YouTube embeds, or social media widgets – force your browser to connect to external servers, making your load speed dependent on their performance.
Start by auditing all third-party scripts and plugins. Remove anything that doesn’t directly enhance the user experience. For heavy resources like YouTube videos, consider using a facade – a static image that loads the actual script only when the user interacts with it. This minimizes unnecessary HTTP requests during the initial load.
For non-critical scripts, apply the async or defer attributes to delay their execution. Whenever possible, host third-party scripts locally to eliminate extra DNS lookups.
Patrick McManus from Firefox highlights the efficiency of modern connections:
"For HTTP/1 74% of our active connections carry just a single transaction – persistent connections just aren’t as helpful as we all want. But in HTTP/2 that number plummets to 25%".
Keep in mind that 40–60% of your visitors arrive with an empty browser cache, making their first impression of your site crucial. Every third-party script you defer, optimize, or eliminate improves that critical initial load time.
Conclusion
Speeding up your website not only enhances user experience but also helps improve your search rankings. One of the best ways to achieve this is by reducing HTTP requests. Every image, stylesheet, script, and font file adds a separate request, and these can pile up quickly. A page load time increase from 2 to 5 seconds can cause bounce rates to jump from 9% to 38%. That delay could cost you valuable visitors.
To tackle this, focus on strategies like combining files, optimizing images, caching, and reviewing third-party scripts. These steps can significantly reduce unnecessary requests and improve load times for first-time visitors with empty caches. As the team behind Yahoo’s YSlow tool explains:
"Reducing the number of HTTP requests in your page is the place to start. This is the most important guideline for improving performance for first time visitors".
Start by auditing your site with tools like Chrome DevTools or Google Lighthouse to identify how many requests your pages are making. Ideally, aim for 10 to 30 files per page for better performance. Many websites currently average between 69 and 75 requests, so even small changes – like compressing images to under 100 KB or deferring non-essential scripts – can make a noticeable difference.
If you’ve implemented these steps and are still looking for improvements, working with an expert can help. For advanced optimizations, consider teaming up with Katy SEO Solutions. Their page speed optimization services are designed to address the specific issues that slow down local business websites and impact search rankings.
FAQs
How does HTTP/2 make websites load faster compared to HTTP/1.1?
HTTP/2 makes websites load faster by using multiplexing, a feature that lets multiple requests and responses occur at the same time over a single connection. This means fewer TCP connections are needed, cutting down on delays and boosting overall efficiency.
It also reduces protocol overhead and includes features like header compression and stream prioritization, which help speed things up even more. These upgrades are especially helpful for websites with lots of content, making browsing smoother and quicker for users.
How can I reduce HTTP requests to speed up my website?
Reducing HTTP requests plays a major role in speeding up your website. Here are some practical ways to cut down on those requests:
- Combine CSS and JavaScript files: Instead of loading multiple files separately, merge them into one. Fewer files mean fewer requests.
- Optimize your images: Use tricks like CSS sprites to group smaller images into one file or implement lazy loading so images load only when needed.
- Turn on browser caching: When caching is enabled, repeat visitors can load previously downloaded resources from their local storage, skipping extra requests.
- Switch to HTTP/2: This protocol allows multiple requests to run at the same time over a single connection, making things faster.
- Cut back on third-party scripts: External scripts and plugins can quickly add up. Stick to only what’s absolutely necessary.
These steps can make a noticeable difference in how quickly your site loads, creating a smoother experience for your users.
How do third-party scripts slow down websites, and what can you do to optimize them?
Third-party scripts can drag down your website’s performance by adding extra HTTP requests, slowing down page rendering, and hogging resources on the main thread. They often depend on external server connections, which can lead to longer load times and a less responsive site.
To keep things running smoothly, it’s a good idea to routinely review these scripts. Identify any that are unnecessary or slowing things down. You can improve performance by deferring scripts that aren’t immediately needed, lazy-loading content, and setting up preconnections to external servers to cut down delays. These tweaks can help your site stay fast and user-friendly while still benefiting from third-party tools.